Chart wizard
A new chart can be created using the chart wizard by selecting insert chart from the menu, toolbar, or context menu. Draw the box where the chart should be inserted.
First Step
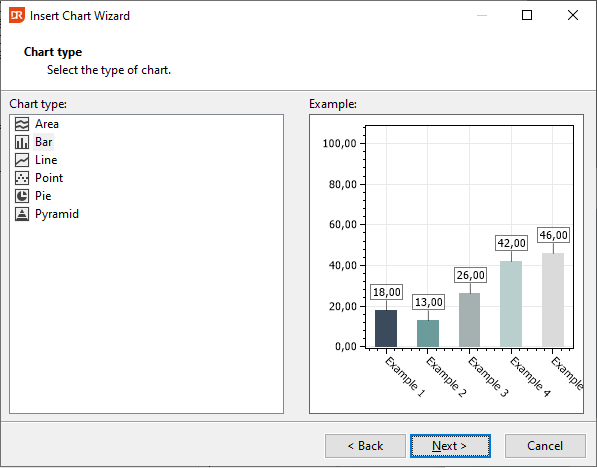
The first step of the wizard is to select the type of chart.
Second Step
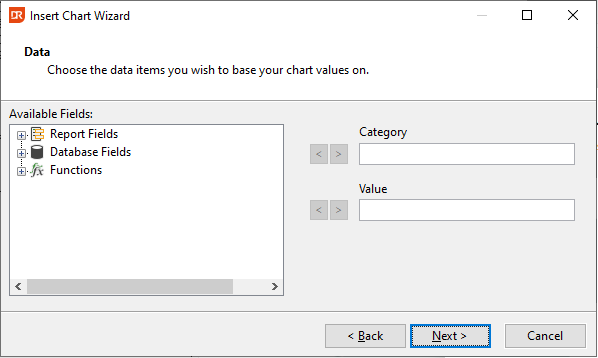
The second step is to choose the data items you wish to use for the chart.
Select a data source for the Category (X-axis) and Value (Y-axis).
There are three types of data available to choose from:
- Report fields. These are objects present in the report design. Only objects that represent a value or calculated item can be selected. Headers, footers, charts, etc. cannot be selected.
- Database fields. Any column of any table can be selected for the Category (X-axis), but only numerical columns can be selected for the Value (Y-axis).
- Functions. All functions defined in the report design can be used as Category or Value.
Third Step
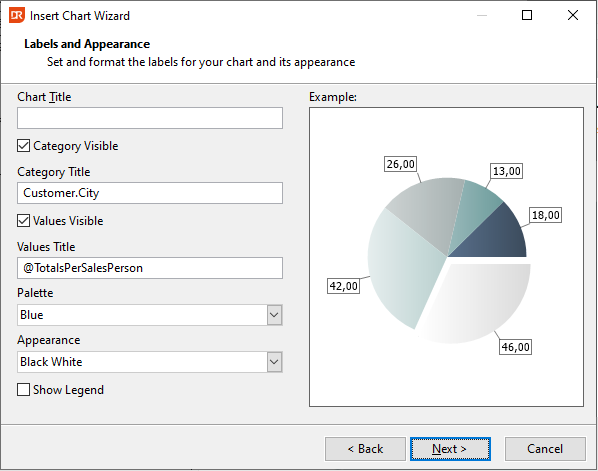
The third step is to set a title, labels, and choose colors.
After clicking Next and OK, the chart is created on the report design. It can be moved and resized like any object, and its object properties can be changed by right-clicking on the chart and selecting Field Properties.
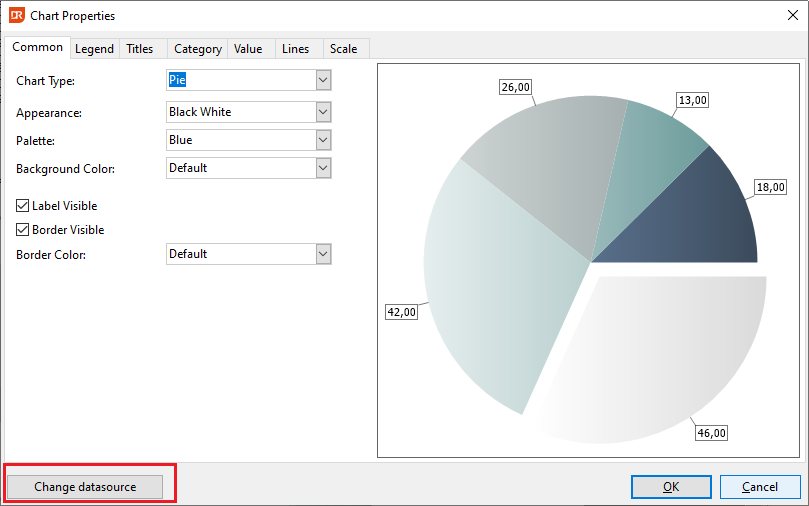
The chart itself can be modified by double-clicking on the chart to open the Chart Properties dialog.
As part of the chart properties dialog, the datasource can be changed. This, in fact, restarts the chart wizard with the choices you already made, allowing you to change the data sources in the second step of the wizard.