Modifying the layout and appearance of a chart
A chart can be modified in three different ways:
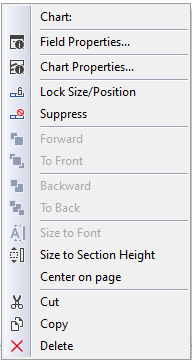
- Field Properties: General object properties such as object name, tooltip text, alignment, position, and size of the chart can be set.
- Chart Properties: This dialog allows changing the chart type, colors, borders, legends, labels, chart title, lines within the chart, and scales.
- Chart datasource: Changing the data source of a chart is still possible after the chart has been created. Just open the chart properties dialog and click on the lower left button "Change datasource". It (re)opens the chart wizard, where in step 2 the data source can be changed.
When you click with the right mouse button on a chart, a popup menu appears where both options 'Chart Properties' and 'Field Properties' are available.