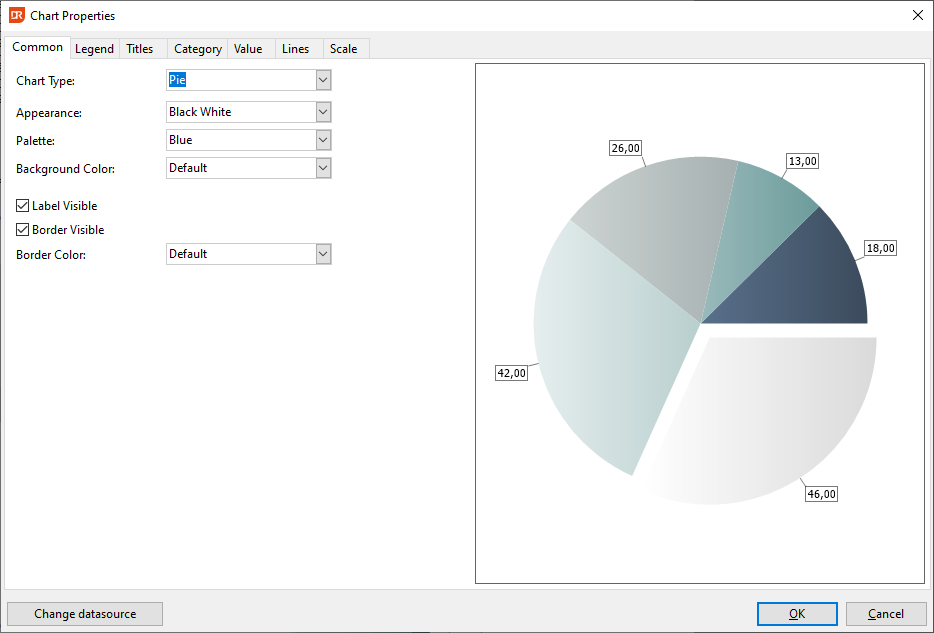
Chart Properties - Common Tab
Within this tab page, users have the capability to modify the chart type. Refer to 'Chart Types' for an overview of the available chart options.
- Appearance and Palette:
- Palette: Specifies the colors utilized for elements such as bars, lines, dots, or slices that represent data values.
-
Appearance: Determines the default colors for the chart's lines and background.
-
Common Border: This setting defines the boundary surrounding the chart. If the color is set to 'default', it adopts the color specified in the currently chosen Appearance scheme.
-
Label Visibility: To enable a tooltip that displays the value associated with a bar, point, or other chart elements, simply check the 'Label Visible' box.