SalesPerSalesPersonPerUSAState
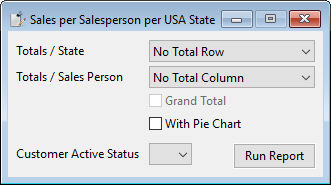
This report view shows how to use two different reports based on user input. If the user selects the "With Pie Chart" checkbox, the code uses a different report. The output of both reports has a lot in common but differs in the display of a pie chart and how to collect the data for the chart. Both reports produce a crosstab style report where the user can control whether there should be a total value per row and/or per column and whether there should be a grand total value. The checkbox for the grand total becomes available when at least one of the total values has been chosen. The data can be filtered based on customer status (this can be yes, no, or nothing, which means all).