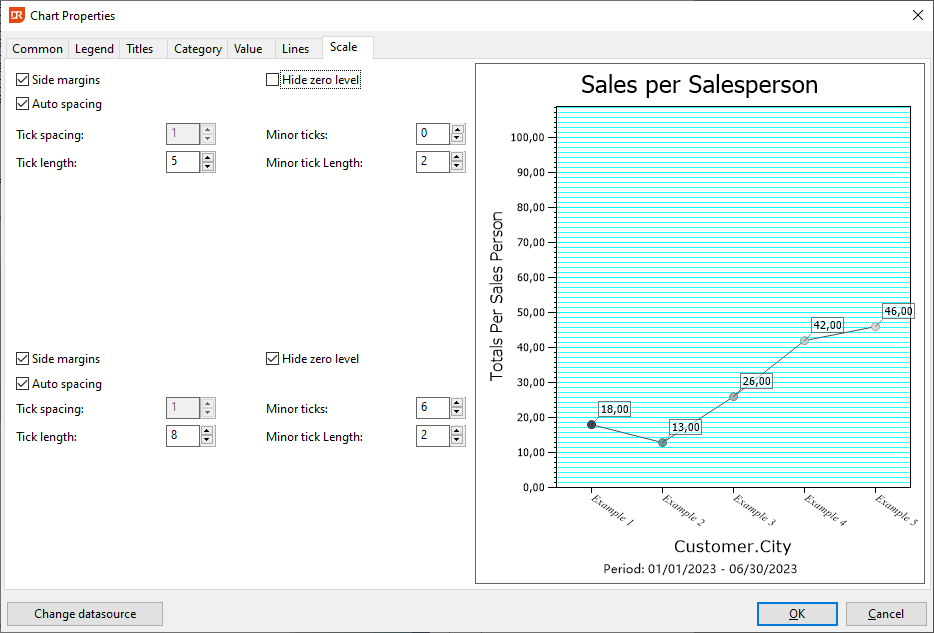
Chart Properties - Scale Tab
In the 'Scale' tab, users can customize the display scale of the axes with various options.
- Side Margins: When enabled, extra space is allocated on both ends of the chart for better visualization.
- Show Zero Level: By unchecking this option, the chart begins with the initial value rather than starting from zero.
- Tick Spacing: This setting allows users to specify the frequency at which 'major' ticks with labels appear on the chart. For instance, if set to 2, a tick with a label will be displayed for every two values.
- Minor Ticks: This determines the number of smaller ticks displayed between each 'major' tick on the chart.