Chart Type - Line
A line chart is used to show a series of data points connected by straight line segments. Charts of this type are generally used to illustrate trends in data over a period of time.
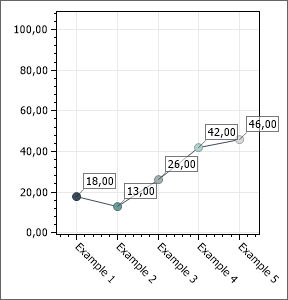
A line chart is used to show a series of data points connected by straight line segments. Charts of this type are generally used to illustrate trends in data over a period of time.