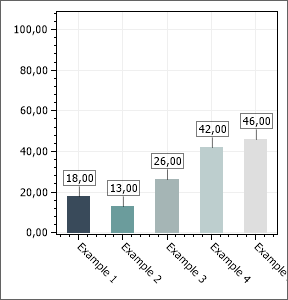
Chart Type Bar
A bar chart displays data with rectangular 'bars' whose lengths are relative to the data they symbolize. Generally, a bar chart is used to display discontinuous data (data that has a discrete value); however, it can also be used for continuous data. Examples of discontinuous data include 'car color' or 'tire size', while examples of continuous data include 'population' or 'age'.