Chart Type - Area
An area chart is very similar to a line chart. Data is displayed using different colors in the 'area' below the line. Area charts are commonly used to display accumulated values over a period of time.
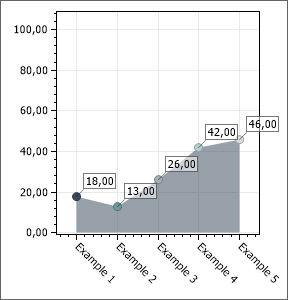
An area chart is very similar to a line chart. Data is displayed using different colors in the 'area' below the line. Area charts are commonly used to display accumulated values over a period of time.