WebGet vs. Get, Debugging Web Apps
In this topic, you will learn how to debug web applications and understand one of the most important topics in web applications: the difference between Get and WebGet. Neither debugging nor WebGet are complicated topics, but they are both cases where a simple test case can really help you understand how they work.
A type of problem that programmers encounter is a program that compiles but then behaves differently than expected. You will discover how to solve such problems using the Debugger.
Debugging
Debugging is the act of observing the run-time behavior of a program and determining the location of semantic errors. With the debugger, you can break (suspend) execution of your program to examine your code, evaluate and edit variables in your program, view data in database tables, and control the execution of the instructions in your source code.
Important!
This section assumes that you have been going through the Quick Start tutorial step by step.
If you skipped the Windows application part of Quick Start, you should read the Handling Compiler Errors section now and return to this page when you have completed it.
Making Code Changes
You are going to make a change in the code of your "Hello World" web view to cause it to behave differently than you want it to behave. Then, you will learn how to use the debugger to track down and solve the problem.
- Switch back to the
HelloWorld.wofile in the Studio.
Tip: You can scroll through all open views by using the Ctrl + Tab or Ctrl + Shift + Tab keyboard shortcuts.
Once you are working in a larger project and have multiple files open, it may become useful to leave the File Navigator window open as a docked window. If the File Navigator is not already open, you can open it by clicking on the File Navigator toolbar button.

Tip: If you double-click on any file in Workspace Explorer: - If the file is not already open, it will open. - If the file is already open, but it is not the currently active window, it will become the active window. - If the file is already open and it is the currently active window, the view will toggle between the code editor and designer (if the file can be modeled in a designer).
Tip: If you have enough windows open in the main Studio pane to exceed the space for tabs on a single row, the tabs will begin scrolling, and you can use the arrow keys to scroll right and left to see more tabs.
As an alternative, you can configure the Studio from Tools > Configure Studio... to display multiple rows of tabs.
For more information about navigating around the Studio, see the Studio help book.
-
Double-click on
Procedure OnClickin Code Explorer to display the code for this function. -
Change the line
WebGet psValue of oNameForm to sName
to
Get psValue of oNameForm to sName
- Click on the Run button on the Studio's toolbar.
When the application runs, your browser should display the http://localhost/QuickStart/Index.html page.
Click on the Views menu, then on Hello World to open the view.
- Type your name into the form labeled
Name(replace "Type your name here" with your name), then click theGobutton.
When you ran this before the code change, you saw "Hello, {Your Name}" in the message box. Now, however, the message box only shows "Hello,".
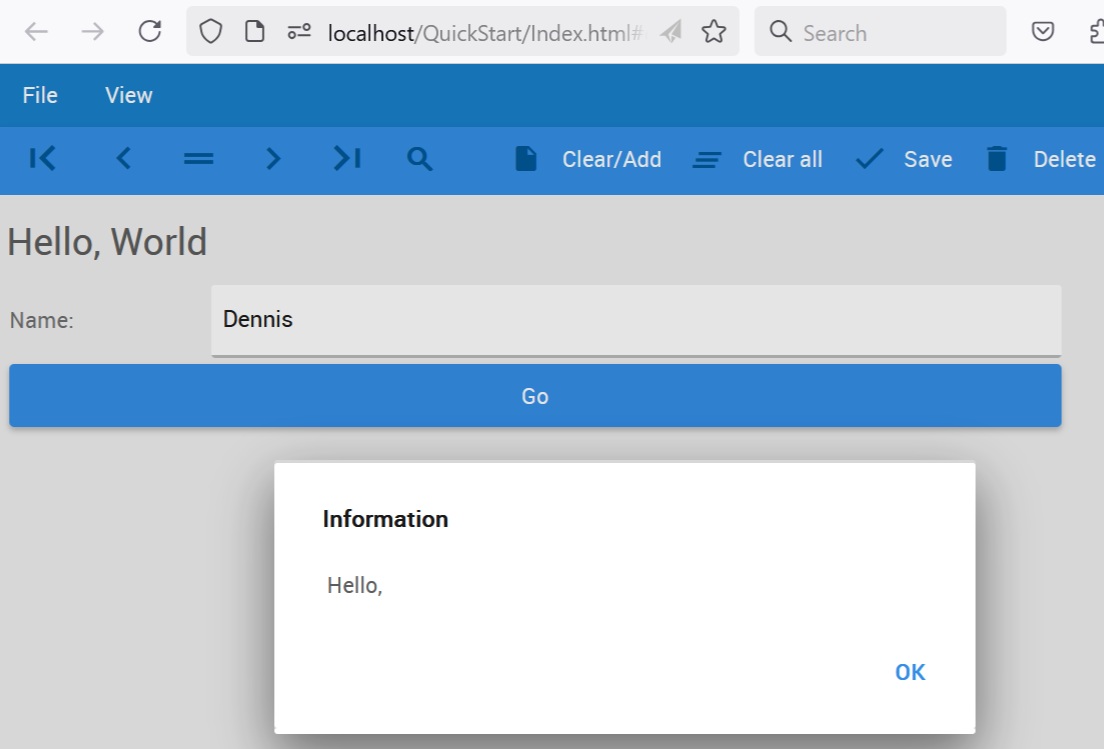
This can result in some pretty serious and tricky programming problems. You will now use the debugger to track down what happened.
- Leave the program running and switch back to the Studio. Click in the left-hand margin of the code editor next to the code line
Send ShowInfoBox ("Hello, " + sName)
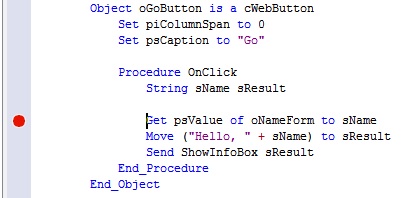
- This will place a red dot in the left margin, indicating that you have just placed a breakpoint on this line of code.
Breakpoints
Debuggers work by causing executing programs to stop and examining the program at this "frozen" time. Breakpoints on lines of code cause the debugger to halt the program when reaching that line of code, just prior to executing it.
- Now you will execute the program up to this line of code to have the debugger stop at this point. Since the breakpoint is in
Procedure OnClickof theGo (oGoButton)button object, you need to run your program and click on theGobutton to get the debugger to execute the program's code up to this breakpoint.
Return to the running program, make sure your name is still in the form, and click on the Go button again.
This time, the program is stopped by the debugger at the breakpoint.
- If you place your mouse cursor over any local variable in
Procedure OnClick, you will see the current value of the variable pop up as a tooltip. Of course, at this point in the code, all variables should show up to be blank.
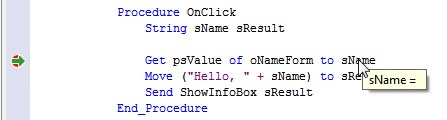
Notice also the green arrow in the left margin, which currently overlaps the red dot for the breakpoint you placed. The green arrow indicates the line on which the program is currently "frozen." This is the next line that will execute in the program.
- Take a look at the Locals window. If the Locals window is not open, click on the Locals icon on the Studio's toolbar.

This will open the Locals window, which lists all local variables and their current values. This is a useful window to keep open when debugging since it reflects the values of all local variables as you step through the code.
- Click on the Step Over button on the Studio's toolbar (or press
F10).

Stepping Through Code
Stepping through code is an important debugging concept. A step causes the debugger to tell the program being debugged to execute lines of code as you tell it to.
The most common step type is Step Over, which remains in the current method and executes the currently selected line of code (the line indicated by the green arrow).
- The debugger has executed the line
Get psValue of oNameForm to sName
Notice that the variable sName now contains "". You can see this in the Locals window and also by holding the mouse cursor over the variable sName anywhere inside Procedure OnClick.
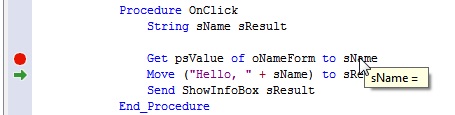
The line of code Get psValue of oNameForm to sName should have retrieved the value in the Name form (your name) and placed it into the variable sName, but instead, sName is blank. Something went wrong in retrieving the form's value.
- Click on the Step Over toolbar button.
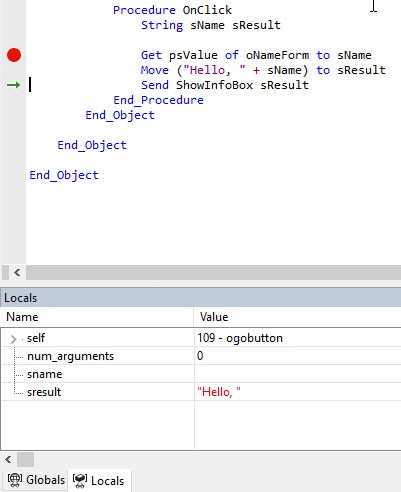
Notice that
Red Values in Locals Window
You will notice that the value of sResult is displayed in red in the Locals window (yellow if running the Studio in Dark Mode). This is a visual cue to indicate that the value of sResult has just changed.
- What we are after in this investigation is the value of the form. This is stored in the
psValueproperty of theoNameFormform.
Take a look at the Watches window. If the Watches window is not open, click on the Watches icon on the Studio's toolbar.

This will open the Watches window, another useful window to keep open when debugging. The Watches window can display any expression you wish to evaluate while debugging. Try it like this:
- You can type or drag and drop a lot of things into the Watches window: variables, properties, expressions to be evaluated (e.g.,
x + y). Right now, we want to see the value of thepsValueproperty of theoNameForm.
Click in the Name column of the Watches window on the first blank row; type psValue(oNameForm) and press Enter.
You will see that the Value column displays the value of the psValue property of the oNameForm, which is "" in our current sample.
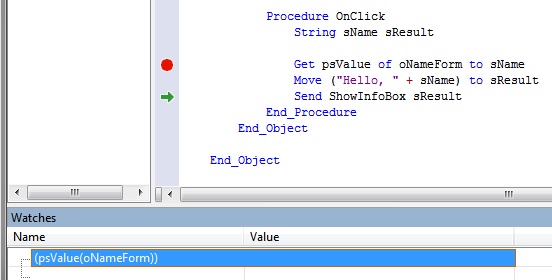
This result is consistent with what the message box is showing.
What is happening is that both the psValue property of the oNameForm and the Get command the program has executed have retrieved the initial value of the psValue property, which is not what was intended.
- There is a way to display the current value of a property in the Debugger.
Click in the Name column of the Watches window on the next blank row and type _wp(oNameForm,"psValue"), then press Enter.
You will see that the Value column now displays "Dennis" (for you, this will likely be your name) in our current sample.
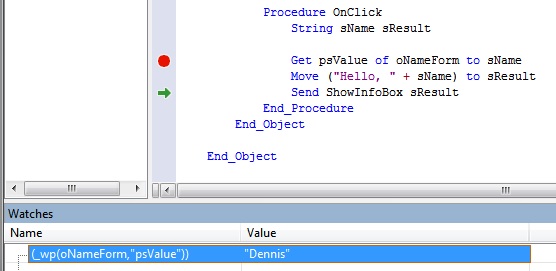
- Make sure you go back and fix your code. Change the line
Get psValue of oNameForm to sName
back to
WebGet psValue of oNameForm to sName
WebGet vs. Get Explained
The _wp function returns the current value of a web property in the debugger (only in the debugger). The WebGet command provides the same functionality in a running web application.
Simply querying a property's value via (PropertyName(ObjectName)) in the debugger returns the initial value of a web property. The Get command provides the same functionality in a running web application.
Understanding this difference between WebGet and Get (as well as WebSet and Set) is crucial to programming web applications. I hope the simple example above has driven home the difference between the two.
Take a step back and think about this lesson. While you were doing each step, you may have been focused on learning the various debugger windows to really focus on the big picture of this lesson.
When getting and setting properties in a running web application, you almost always want to use WebGet and WebSet, not Get and Set. WebGet and WebSet work with properties' current values, not their initial values. So, in order to access property values in a running program, which may have been changed by your user(s), use WebGet and WebSet!
We encourage you to spend some time debugging; it is a very powerful tool and the features we have shown you here barely scratch the surface of what you can do. Mastering debugging will help you understand how DataFlex works and make you a better programmer!
See the Debugging topic of the Studio help book for more information regarding debugging.
Next Step
Next, you will learn how to align web controls to create good-looking, functional layouts: Aligning Web Controls