Debugging Code in Windows Applications
A type of problem that programmers encounter is a program that compiles but then behaves differently than expected. You will discover how to solve such problems using the Debugger.
Debugging
Debugging is the act of observing the run-time behavior of a program and determining the location of semantic errors. With the debugger, you can break (suspend) execution of your program to examine your code, evaluate and edit variables in your program, view data in database tables, and control the execution of the instructions in your source code.
Once again, you are going to make a change in the code of your "Hello World" view, this time to cause it to behave slightly differently than you want it to behave. Then, you will learn how to use the debugger to track down and solve the problem.
- Double-click on the button control in the visual editor or Code Explorer to display the code for the button object.
- Change the line
move "Hello, " to sHello
to
move "Hello," to sHello
(remove the space following the comma in 'Hello,'). 3. Click on the Run button on the Studio's toolbar. When the application runs, click on the View menu and then Hello World to open the view. 4. Type your name into the Name form and click on the Go button.
You will see that the text that appears in the Result form now is, for example, "Hello,John", with the space between the comma and the name missing. You will now use the debugger to track down why the space is missing. 5. Leave the program running and switch back to the Studio. Click in the left-hand margin of the code editor next to the code line
get Value of oNameForm to sName
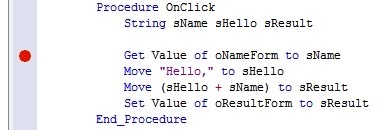
- This will place a red dot in the left margin, indicating that you have just placed a breakpoint on this line of code.
Breakpoints
Debuggers work by causing executing programs to stop and examining the program at this "frozen" time. Breakpoints on lines of code cause the debugger to halt the program when reaching that line of code, just prior to executing it.
- Now you will execute the program up to this line of code to have the debugger stop at this point. Since the breakpoint is in the OnClick event of the button, you need to run your program and click on the button to get the debugger to execute the program's code up to this breakpoint.
Return to the running program and click on the Go button again.
This time, the program is stopped by the debugger at the breakpoint. 2. If you place your mouse cursor over any local variable in Procedure OnClick, you will see the current value of the variable pop up as a tooltip. Of course, at this point in the code, all variables should show up to be blank.
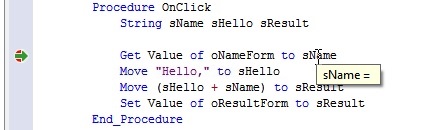
Notice also the green arrow in the left margin, which currently overlaps the red dot for the breakpoint you placed. The green arrow indicates the line on which the program is currently "frozen". This is the next line that will execute in the program. 3. Take a look at the Locals window. If the Locals window is not open, click on the Local Variables Watch Window icon on the Studio's toolbar.

This will open the Locals window, which lists all local variables and their current values. This is a useful window to keep open when debugging, since it reflects the values of all local variables as you step through the code.
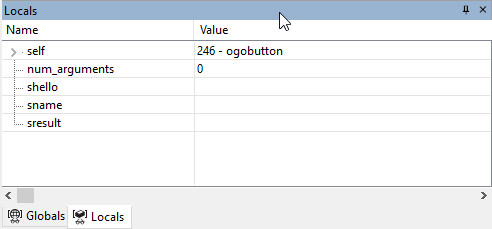 4. Click on the Step Over button on the Studio's toolbar (or press F10).

Stepping through Code
Stepping through code is an important debugging concept. A step causes the debugger to tell the program being debugged to execute lines of code as you tell it to.
The most common step type is Step Over, which remains in the current method and executes the currently selected line of code (the line indicated by the green arrow).
- The debugger has executed the line
get Value of oNameForm to sName
Notice that the variable sName now contains the name you typed into the Name form of the program. You can see this in the Locals window and also by holding the mouse cursor over the variable sName anywhere inside Procedure OnClick.
2. Click on the Step Over toolbar button.
Notice that the variable sHello now contains "Hello," and sName still contains the name you typed into the Name form.
3. Click on the Step Over toolbar button.
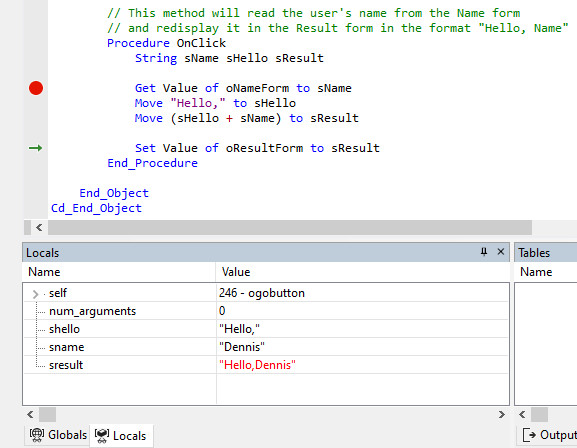
The variable sHello now contains "Hello," sName contains the name you typed into the Name form, and sResult contains the concatenated result of sHello + sName ("Hello,Dennis" in our example).
It is now readily apparent that the reason for the missing space is that there was no space placed either at the end of sHello or the beginning of sName.
Red Values in Locals Window
You will notice that the value of sResult is displayed in red in the Locals window (yellow if running the Studio in Dark Mode). This is a visual cue to indicate that the value of sResult has just changed.
- Take a look at the Watches window. If the Watches window is not open, click on the Watches Window icon on the Studio's toolbar.

This will open the Watches window, another useful window to keep open when debugging. The Watches window can display any expression you wish to evaluate while debugging. Try it like this:
-
Double-click on
sResultin the code editor (this selects the entire word). Drag and drop it into the Name column of the Watches window.You will see that the Value column displays the current value of
sResult, which is "Hello,Dennis" in our current sample. -
Highlight the expression
(sHello + sName)in the code editor (this selects the entire word). Drag and drop it into the Name column of the Watches window.You will see that the Value column displays the current value of
(sHello + sName), which is "Hello,Dennis" in our current sample (just likesResult).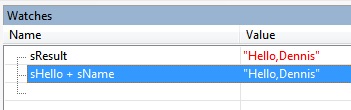
-
Click in the Name column of the Watches window of the row which currently contains
(sHello + sName). This will highlight the entire current row. If you click in the Name column once more, you will see that it is now editable.Change the expression to
(sHello + " " + sName)and press Enter.You will see that the Value column now displays the current value of
(sHello + " " + sName), which is "Hello, Dennis" in our current sample.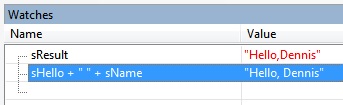
We encourage you to spend some time debugging; it is a very powerful tool and the features we have shown you here barely scratch the surface of what you can do. Mastering debugging will help you understand how DataFlex works and make you a better programmer!
See the Debugging topic of the Studio help book for more information regarding debugging.
See Breakpoints to read more about managing breakpoints.
Next Step
You have just learned how to create a Windows application and a view in the DataFlex Studio, and how to compile and debug them.
To learn how to add help to a Windows application, go on to Adding Help to Your Windows Applications.
To learn how to create web applications, go on to Creating Your First Web Application.