ChartControl Control

Description
Chart Control.
For a list of all members defined in this module, see ChartControl members.
Object Model







Remarks
Chart Pro is an advanced chart library for Windows environment software development. The Chart ActiveX control brings the chart to virtually every development platform for Windows. The Chart Pro controls are easy to understand and can be implemented in only a few lines of code, but they also provide a rich set of classes for customization and enhancement.
For a complete overview of all chart types, see this overview.
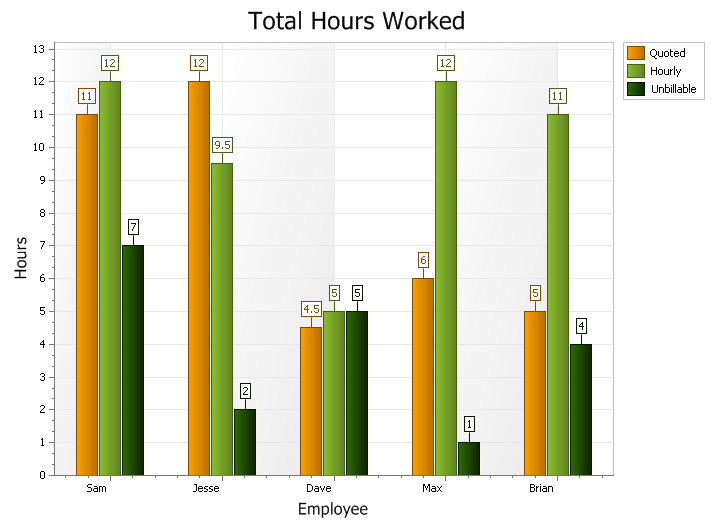
Chart Pro has many different chart styles that include Line, Spline, Spline Area, Point/Scatter, Bubble, Bar, Area, Pie, 3D Pie, Doughnut, Stock/Bar, CandleStick, Torus, Pyramid, and more.
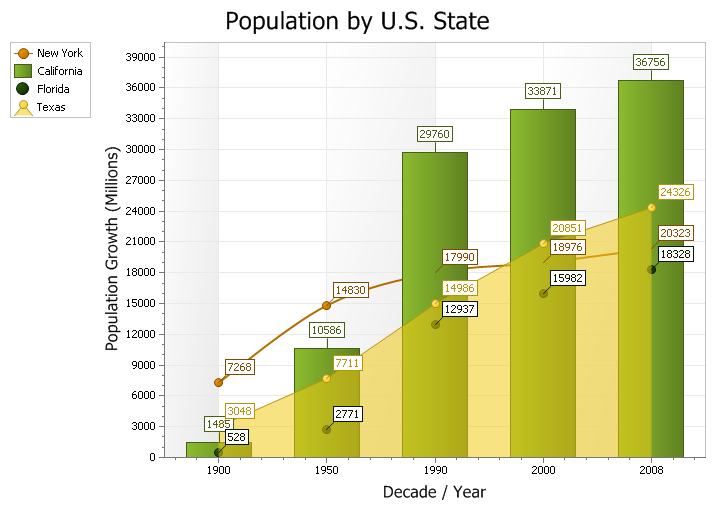
A combination chart can also be created. A combination chart uses two or more chart types to emphasize that the chart contains different types of data.
The code for this combination chart is displayed below.
Example
' Shows how to display a combination of styles in the same diagram
ChartControl.Content.Titles(0).Text = "Population by U.S. State"

ChartControl.Content.Legend.Visible = True
ChartControl.Content.Legend.HorizontalAlignment = xtpChartLegendNearOutside

Dim Series As ChartSeries

Set Series = ChartControl.Content.Series.Add("New York")

Series.Points.Add 1900, 7268
Series.Points.Add 1950, 14830
Series.Points.Add 1990, 17990
Series.Points.Add 2000, 18976
Series.Points.Add 2008, 18323

Set Series = ChartControl.Content.Series.Add("California")

Series.Points.Add 1900, 1485
Series.Points.Add 1950, 10586
Series.Points.Add 1990, 29760
Series.Points.Add 2000, 33871
Series.Points.Add 2008, 36756

Set Series = ChartControl.Content.Series.Add("Florida")

Series.Points.Add 1900, 528
Series.Points.Add 1950, 2771
Series.Points.Add 1990, 12937
Series.Points.Add 2000, 15982
Series.Points.Add 2008, 18328

Set Series = ChartControl.Content.Series.Add("Texas")

Series.Points.Add 1900, 3048
Series.Points.Add 1950, 7711
Series.Points.Add 1990, 14986
Series.Points.Add 2000, 20851
Series.Points.Add 2008, 24326

Set ChartControl.Content.Series(3).Style = New ChartAreaSeriesStyle
Set ChartControl.Content.Series(2).Style = New ChartPointSeriesStyle
Set ChartControl.Content.Series(1).Style = New ChartBarSeriesStyle
Set ChartControl.Content.Series(0).Style = New ChartSplineSeriesStyle

Set Diagram = ChartControl.Content.Series(0).Diagram
Diagram.AxisY.Title = "Population Growth (Millions)"
Diagram.AxisY.Title.Visible = True
Diagram.AxisX.Title = "Decade / Year"
Diagram.AxisX.Title.Visible = True
See Also
Copyright (c) 1998-2024 Codejock Technologies. All rights reserved.