Differences in Rendering between WinPrint 1 & 2
Margins
WinPrint 1 miscalculated left/right page margins. This has been corrected in WinPrint 2. This may affect where word-wrapping occurs in your reports.
The total print margin is calculated by adding the printer's non-printable region plus the user-defined report margins (as specified by the DFSetMargins command).
WinPrint 1 did not add the printer's non-printable left and right margin to the user-defined left and right margin.
This can be illustrated by defining a report where the user-defined margins are set to 0 or a very small value using the DFSetMargins message, e.g.:
Send DFSetMargins of WinPrintId 0.5 0.5 0.5 0.5
The following graphics illustrate the difference between WinPrint 1 and WinPrint 2 for the same report. The yellow area represents the printer's non-printable region (the region of a page that the printer cannot reach).
WinPrint 1

WinPrint 2
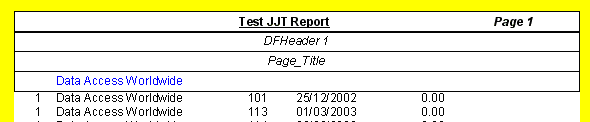
In WinPrint 1, the incorrect rendering is only observed when the report is rendered in the viewer. When the report is sent to the printer, it is properly scaled and positioned to account for the printer's non-printable region.
Clipping to Margin
WinPrint 1 would print text outside the user-defined right margin. This bug has been corrected in WinPrint 2 so that text which is specified to print beyond the right margin is now clipped.
Headers/Footers
WinPrint 1 miscalculated the non-printable header and footer regions of a report page. This resulted in headers being written to the wrong location and footers sometimes not being printed at all.
The non-printable header & footer is the region at the top and bottom of a page where a specific printer is unable to print. Each printer will have a different sized non-printable regions of a page.
Because of the way WinPrint 1 miscalculated these regions, it is possible that you have made positional adjustments in your report to ensure that footers are rendered on a page. If this is the case, then when your report is rendered in WinPrint 2, the footer location will be over-adjusted.
Bitmaps not Transparent
WinPrint 1 applies a transparency formula to bitmaps. This is not supported in WinPrint 2.
Line Spacing
Calculation of the line height for successive DFWriteln commands was slightly too small in WinPrint 1. This has been corrected in WinPrint 2.
Maximum Length in DFWritePos
The maximum length parameter of the DFWritePos command was not being calculated correctly in WinPrint 1. This is especially evident when bold text is printed. This has been corrected in WinPrint 2. As a result, you may notice some bolded text is clipped when you convert your reports to WinPrint 2. You will need to adjust the maximum width parameter of these commands accordingly.
Line Drawing
The line thickness calculation in the DFWriteXYLine command is more accurate in WinPrint 2.
Rectangle/Ellipse Drawing
In WinPrint 1, rectangles (and ellipses) were drawn so that the center of the line was drawn at the coordinates that were given. The diagram below illustrates how a rectangle designed to be 6 CM wide at a position of 4 CM from the margin with a thickness of 1 CM was actually drawn 7 CM wide and from a position of 3.5 CM from the margin.
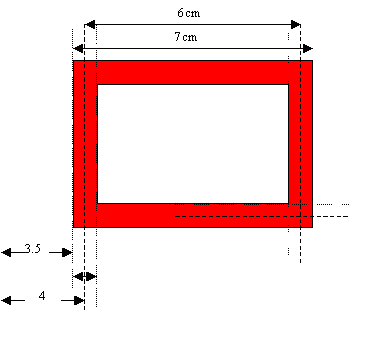
In WinPrint 2, this has been corrected, so that the rectangle is drawn within the area that you supply. That is, it will now be 6 CM wide and start from 4 CM from the margin. Because of this change, rectangles and ellipses will be smaller than they were in WinPrint 1, and you may need to adjust your code. The formula for this is quite simple: the width and height should be incremented by the width of the line; the position should be decremented by half the width of the line. So, in this example, the width would need to be set to 7 (calculated as 6 + 1) and the position to 3.5 (calculated as 4 - (1/2)).
If you used a small line width, then you probably won’t notice this change.
Header Size Adjustment With Graphics
When a graphic item, such as a rectangle or bitmap, is drawn inside a header section, then the section's height is adjusted if necessary to accommodate the graphic. In WinPrint 1, this adjustment did not take into consideration the vertical offset of the graphic from the top of the header. This would cause the graphic to overflow out of the bottom of the header. WinPrint 2 correctly considers the vertical offset of the graphic when calculating the height of the header.
Charting
WinPrint 2 does not support charting. Reports that use charting should continue to use WinPrint 1.
Floating Text vs Fixed Text
WinPrint 2 introduces a strong distinction between text that is written using DFWritePos and text written using DFWrite.
- Text written using
DFWritePosis considered to be 'fixed' text, i.e., its horizontal position is explicitly fixed. - Text written using
DFWriteis considered 'floating' text, i.e., its horizontal position is variable depending on what other floating text has come before it.
In WinPrint 2, the horizontal position of floating text is not affected by fixed text. It is still affected by other floating text on the same line.
In WinPrint 1, the following code:
DFWritePos "Customer: " 0.0
DFWrite Customer.Name
Would be output as:
"Customer: John Smith"
In WinPrint 2, the position of the floating text (Customer.Name) would not be affected by the fixed text. This is different from WinPrint 1.
The position of floating text can be affected by the current header justification and various other attributes such as DFGR_SETPOS. This is the same as WinPrint 1.
The position of fixed text is not affected by the current header justification and various other attributes such as DFGR_SETPOS. This is different from WinPrint 1.
The result of these changes means that with WinPrint 2, you can always predict the horizontal position of fixed text. This was not always the case with WinPrint 1.