ChartStepLineSeriesStyle Object
Description
Step Line chart style.
For a list of all members defined in this module, see ChartStepLineSeriesStyle Members.
Object Model






Remarks
The Step Line chart is another form of a Line chart. Unlike the traditional line chart, Step line charts only use vertical and horizontal lines to connect the data points, forming what looks like steps.
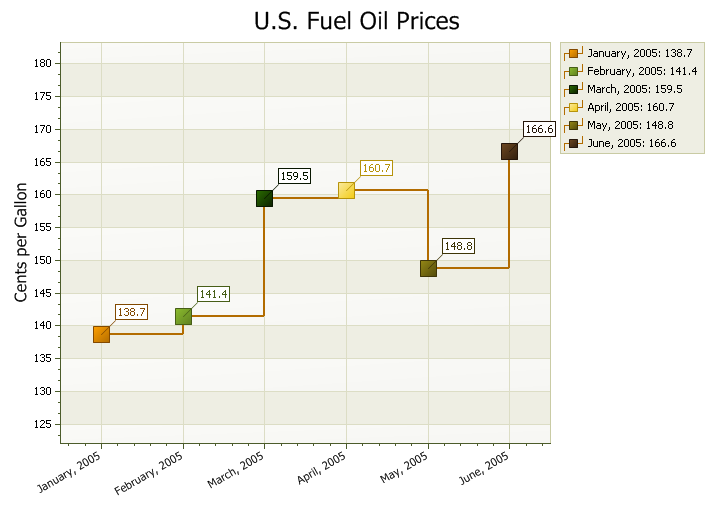
Example
' StepLine Sample

ChartControl.Content.Legend.Visible = True

If ChartControl.Content.Series.Count > 0 Then
    ChartControl.Content.Series.DeleteAll
End If

ChartControl.Content.Legend.Visible = True

Dim Series As ChartSeries
Set Series = ChartControl.Content.Series.Add("U.S. Fuel Oil Prices")

Series.Points.Add "January, 2005", 138.7
Series.Points.Add "February, 2005", 141.4
Series.Points.Add "March, 2005", 159.5
Series.Points.Add "April, 2005", 160.7
Series.Points.Add "May, 2005", 148.8
Series.Points.Add "June, 2005", 166.6

ChartControl.Content.Titles.Add "U.S. Fuel Oil Prices"
ChartControl.Content.Legend.Visible = True

Dim Style As New ChartStepLineSeriesStyle
Set ChartControl.Content.Series(0).Style = Style

Style.ColorEach = True
Style.Marker.Type = xtpChartMarkerSquare
Style.Marker.Size = 16
Style.Label.LineLength = 20

Dim Diagram As ChartDiagram2D
Set Diagram = ChartControl.Content.Series(0).Diagram
Diagram.AxisY.Title = "Cents per Gallon"
Diagram.AxisY.Title.Visible = True

Diagram.AxisY.Interlaced = True
Diagram.AxisX.Interlaced = False
Diagram.AxisY.Range.ShowZeroLevel = False

Diagram.AxisX.Label.Angle = 360 - 30
Diagram.AxisX.Label.Antialiasing = True
See Also
ChartStepLineSeriesStyle Members
Copyright (c) 1998-2024 Codejock Technologies. All rights reserved.