ChartStackedBarSeriesStyle Object
Description
Stacked Bar / 100% Stacked Bar chart.
For a list of all members defined in this module, see ChartStackedBarSeriesStyle Members.
Object Model






Remarks
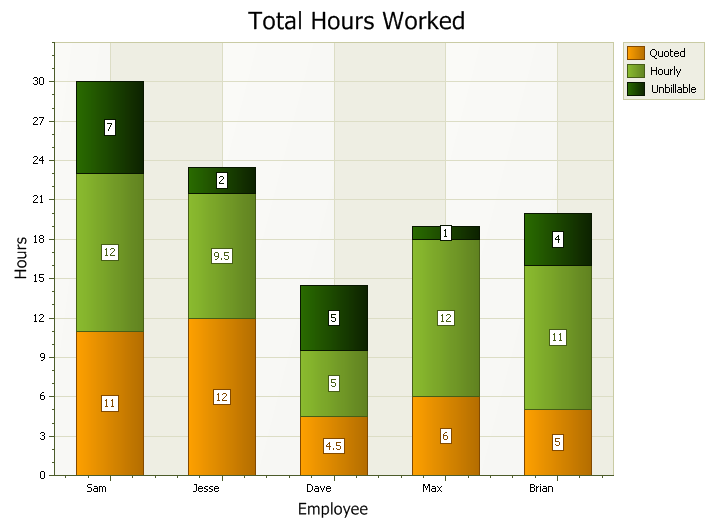
A stacked bar chart is similar to a standard bar chart except the bars for a given argument will be stacked on top of each other. You can stack the bars vertically or horizontally. This type of chart is used to compare the relationship of parts to the whole. Each bar is used to represent a total. For example, you could show the number of males/females that prefer each of the 4 major sports (football, basketball, hockey, baseball) in a stacked bar chart. There would be 4 stacked bars, each divided into 2 categories (male/female).
Example
This sample shows how to add a 100% stacked bar:
ChartControl.Content.Legend.Visible = True
ChartControl.Content.Legend.HorizontalAlignment = xtpChartLegendFar
ChartControl.Content.EnableMarkup = True

If ChartControl.Content.Series.Count > 0 Then
    ChartControl.Content.Series.DeleteAll
End If

ChartControl.Content.Titles.Add "Total Hours Worked"
ChartControl.Content.Legend.Visible = True
ChartControl.Content.Legend.HorizontalAlignment = xtpChartLegendFarOutside

Dim Series As ChartSeries
Set Series = ChartControl.Content.Series.Add("Quoted")

Series.Points.Add "Sam", 11
Series.Points.Add "Jesse", 12
Series.Points.Add "Dave", 4.5
Series.Points.Add "Max", 6
Series.Points.Add "Brian", 5

Set Series = ChartControl.Content.Series.Add("Hourly")
Series.Points.Add "Sam", 12
Series.Points.Add "Jesse", 9.5
Series.Points.Add "Dave", 5
Series.Points.Add "Max", 12
Series.Points.Add "Brian", 11

Set Series = ChartControl.Content.Series.Add("Unbillable")
Series.Points.Add "Sam", 7
Series.Points.Add "Jesse", 2
Series.Points.Add "Dave", 5
Series.Points.Add "Max", 1
Series.Points.Add "Brian", 4

Set ChartControl.Content.Series(0).Style = New ChartStackedBarSeriesStyle
Set ChartControl.Content.Series(1).Style = New ChartStackedBarSeriesStyle
Set ChartControl.Content.Series(2).Style = New ChartStackedBarSeriesStyle

ChartControl.Content.Series(0).Style.StackHeight = 100
ChartControl.Content.Series(1).Style.StackHeight = 100
ChartControl.Content.Series(2).Style.StackHeight = 100

Dim Diagram As ChartDiagram2D
Set Diagram = ChartControl.Content.Series(0).Diagram
Diagram.AxisY.Title.Visible = True
Diagram.AxisY.Title.Text = "Hours"
Diagram.AxisX.Title.Visible = True
Diagram.AxisX.Title.Text = "Employee"

Diagram.AxisX.Label.Angle = 360
See Also
ChartStackedBarSeriesStyle Members
Copyright (c) 1998-2024 Codejock Technologies. All rights reserved.