ChartScatterLineSeriesStyle Object
Description
Scatter chart style.
For a list of all members defined in this module, see ChartScatterLineSeriesStyle Members.
Object Model






Remarks
A Scatter chart is similar to a line chart; however, the scatter chart will plot the data values in the exact order that they are entered and connect the plots with a line (unlike the line chart, which will order the data based on the x and y axis). Scatter charts can be used for scientific data or as a trend chart.
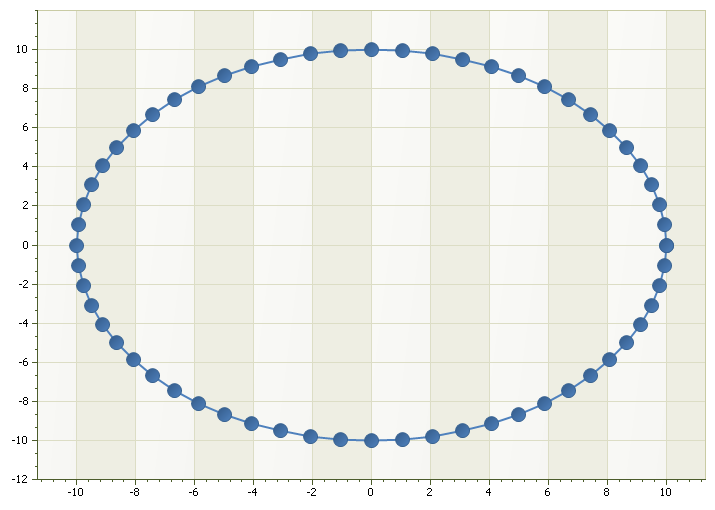
Example
// Scatterline Sample

ChartControl.Content.Legend.Visible = True
ChartControl.Content.Legend.HorizontalAlignment = xtpChartLegendFar
ChartControl.Content.EnableMarkup = True

Dim Series As ChartSeries
Set Series = ChartControl.Content.Series.Add("Series")

Dim cnt As Long, i As Long
cnt = 60
Dim PI As Double
PI = 4 * Atn(1)

For i = 0 To cnt
    Series.Points.Add Cos(2 * PI / cnt * i) * 10, Sin(2 * PI / cnt * i) * 10
Next i

Set Series.Style = New ChartScatterLineSeriesStyle
Series.ArgumentScaleType = xtpChartScaleNumerical

ChartControl.Content.Legend.Visible = False
See Also
ChartScatterLineSeriesStyle Members
Copyright (c) 1998-2024 Codejock Technologies. All rights reserved.