ChartRangeBarSeriesStyle Object
Description
Range Bar Style.
For a list of all members defined in this module, see ChartRangeBarSeriesStyle Members.
Object Model









Remarks
A Range Bar is used to display data/events that have a finite beginning and end value. The range bar can be displayed both overlapped or side-by-side so the different ranges of data can easily be compared to each other. A Range Bar chart is a chart with rectangular Range Bars with lengths proportional to the values that they represent. Range Bar charts are used for comparing two or more values that were taken over time or under different conditions, usually on small data sets.
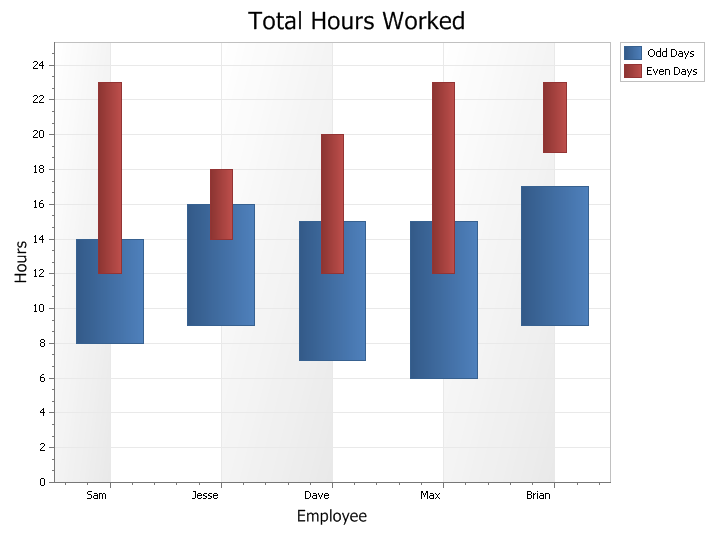
Example
// RangeBar sample

ChartControl.Content.Legend.Visible = True
ChartControl.Content.Legend.HorizontalAlignment = xtpChartLegendFar
ChartControl.Content.EnableMarkup = True

If ChartControl.Content.Series.Count > 0 Then
    ChartControl.Content.Series.DeleteAll
End If

ChartControl.Content.Titles.Add "Total Hours Worked"
ChartControl.Content.Legend.Visible = True
ChartControl.Content.Legend.HorizontalAlignment = xtpChartLegendFarOutside

Dim Series As ChartSeries
Set Series = ChartControl.Content.Series.Add("Odd Days")

Series.Points.Add2 "Sam", 8, 14
Series.Points.Add2 "Jesse", 9, 16
Series.Points.Add2 "Dave", 7, 15
Series.Points.Add2 "Max", 6, 15
Series.Points.Add2 "Brian", 9, 17

Set Series = ChartControl.Content.Series.Add("Even Days")
Series.Points.Add2 "Sam", 12, 23
Series.Points.Add2 "Jesse", 14, 18
Series.Points.Add2 "Dave", 12, 20
Series.Points.Add2 "Max", 12, 23
Series.Points.Add2 "Brian", 19, 23

Set ChartControl.Content.Series(0).Style = New ChartRangeBarSeriesStyle
Set ChartControl.Content.Series(1).Style = New ChartRangeBarSeriesStyle

ChartControl.Content.Series(0).Style.Label.Visible = False
ChartControl.Content.Series(1).Style.Label.Visible = False

ChartControl.Content.Series(1).Style.BarWidth = 0.2

Dim Diagram As ChartDiagram2D
Set Diagram = ChartControl.Content.Series(0).Diagram
Diagram.AxisY.Title.Visible = True
Diagram.AxisY.Title.Text = "Hours"
Diagram.AxisX.Title.Visible = True
Diagram.AxisX.Title.Text = "Employee"

Diagram.AxisX.Label.Angle = 360
See Also
ChartRangeBarSeriesStyle Members
Copyright (c) 1998-2024 Codejock Technologies. All rights reserved.