ChartPyramidSeriesStyle Object
Description
Pyramid 2D style.
For a list of all members defined in this module, see ChartPyramidSeriesStyle Members.
Object Model




Remarks
The Pyramid chart displays a series of data in a pyramid shape. The size of the pyramid sections are all relative to each other, and the order does not matter. You can have a "top heavy" pyramid where the largest section is the top section or any other combination.
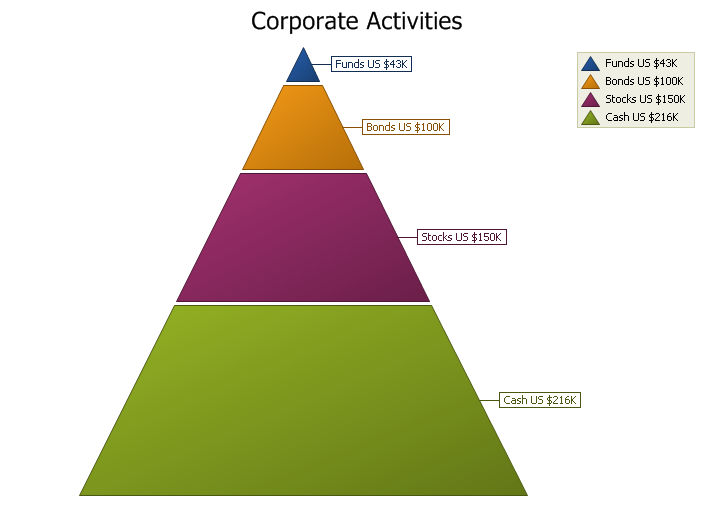
Example
ChartControl.Content.Legend.Visible = True
ChartControl.Content.Legend.HorizontalAlignment = xtpChartLegendFar
ChartControl.Content.Legend.VerticalAlignment = xtpChartLegendNear

If ChartControl.Content.Series.Count > 0 Then
    ChartControl.Content.Series.DeleteAll
End If

ChartControl.Content.Titles.Add "Corporate Activities"

Dim Series As ChartSeries
Set Series = ChartControl.Content.Series.Add("Corporate Activities")

Series.Points.Add "Funds US", 43
Series.Points.Add "Bonds US", 100
Series.Points.Add "Stocks US", 150
Series.Points.Add "Cash US", 216

Series.PointLegendFormat = "{A} ${V}K"

Dim Style As New ChartPyramidSeriesStyle
Set ChartControl.Content.Series(0).Style = Style
Style.Label.Format = "{A} ${V}K"

cmbPointDistance.AddItem "0"
cmbPointDistance.AddItem "1"
cmbPointDistance.AddItem "2"
cmbPointDistance.AddItem "3"
cmbPointDistance.AddItem "4"

cmbHeightToWidth.AddItem "0"
cmbHeightToWidth.AddItem "0.4"
cmbHeightToWidth.AddItem "0.6"
cmbHeightToWidth.AddItem "1"
cmbHeightToWidth.AddItem "1.5"
cmbHeightToWidth.AddItem "2"
See Also
ChartPyramidSeriesStyle Members
Copyright (c) 1998-2024 Codejock Technologies. All rights reserved.