ChartPointSeriesStyle Object
Description
Point Chart Style.
For a list of all members defined in this module, see ChartPointSeriesStyle members.
Object Model





Remarks
A point chart displays data in a grid using Cartesian coordinates. Data is displayed along the x and y axes, where x and y can represent any type of data (as in the chart below, x - decades, y - population). A point chart is also referred to as a plot or scatter chart.
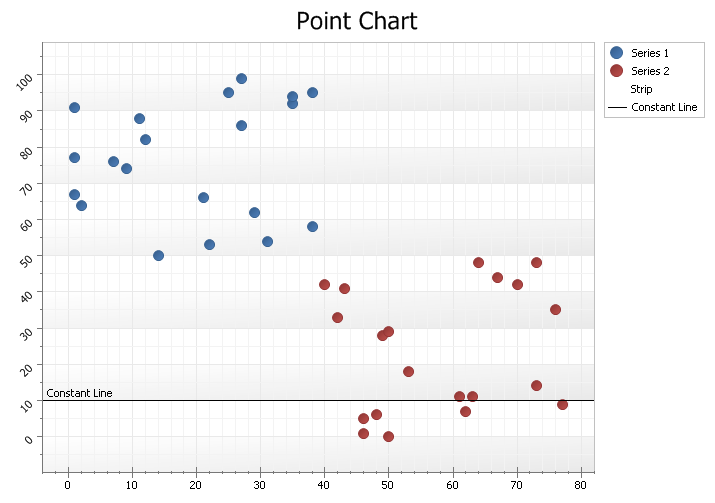
Example
' Point series style

ChartControl.Content.Titles(0).Text = "Point Chart"
ChartControl.Content.Legend.Visible = True
ChartControl.Content.Legend.HorizontalAlignment = xtpChartLegendFarOutside

Dim Series As ChartSeries
Set Series = ChartControl.Content.Series.Add("Series 1")

Series.ArgumentScaleType = xtpChartScaleNumerical

Series.Points.Add 1, 67
Series.Points.Add 14, 50
Series.Points.Add 9, 74
Series.Points.Add 38, 58
Series.Points.Add 2, 64
Series.Points.Add 25, 95
Series.Points.Add 1, 77
Series.Points.Add 1, 91
Series.Points.Add 35, 92
Series.Points.Add 27, 86
Series.Points.Add 31, 54
Series.Points.Add 22, 53
Series.Points.Add 12, 82
Series.Points.Add 21, 66
Series.Points.Add 38, 95
Series.Points.Add 7, 76
Series.Points.Add 11, 88
Series.Points.Add 29, 62
Series.Points.Add 27, 99
Series.Points.Add 35, 94

Set Series = ChartControl.Content.Series.Add("Series 2")
Series.Points.Add 63, 11
Series.Points.Add 42, 33
Series.Points.Add 73, 14
Series.Points.Add 61, 11
Series.Points.Add 53, 18
Series.Points.Add 67, 44
Series.Points.Add 62, 7
Series.Points.Add 77, 9
Series.Points.Add 43, 41
Series.Points.Add 49, 28
Series.Points.Add 76, 35
Series.Points.Add 70, 42
Series.Points.Add 48, 6
Series.Points.Add 40, 42
Series.Points.Add 64, 48
Series.Points.Add 46, 5
Series.Points.Add 50, 29
Series.Points.Add 50, 0
Series.Points.Add 46, 1
Series.Points.Add 73, 48

Set ChartControl.Content.Series(0).Style = New ChartPointSeriesStyle
Set ChartControl.Content.Series(1).Style = New ChartPointSeriesStyle

Dim Diagram As ChartDiagram2D
Set Diagram = ChartControl.Content.Series(0).Diagram

Diagram.AxisY.Visible = True
Diagram.AxisY.Alignment = xtpChartAxisNear
Diagram.AxisY.Interlaced = True
Diagram.AxisY.MinorCount = 1
Diagram.AxisY.Thickness = 1
Diagram.AxisX.Thickness = 1

Diagram.AxisX.Label.Visible = True
' Diagram.AxisX.Title.Visible = True
Diagram.AxisX.Title.Text = "Axis Title"

Diagram.AxisY.Label.Angle = -45
Diagram.AxisY.Label.Antialiasing = True

Diagram.AxisX.TickMarks.CrossAxis = True
Diagram.AxisX.TickMarks.Length = 5
Diagram.AxisX.TickMarks.Thickness = 1
Diagram.AxisX.TickMarks.MinorLength = 1
Diagram.AxisX.TickMarks.MinorThickness = 1
Diagram.AxisX.TickMarks.MinorVisible = True
Diagram.AxisX.TickMarks.Visible = True

Diagram.AxisX.GridLines.Visible = True
Diagram.AxisX.GridLines.MinorVisible = True
Diagram.AxisX.Interlaced = False

Diagram.AxisY.GridLines.Visible = True
Diagram.AxisY.GridLines.MinorVisible = True

Diagram.AxisX.GridLines.LineStyle.DashStyle = xtpChartDashStyleSolid
Diagram.AxisX.GridLines.MinorLineStyle.DashStyle = xtpChartDashStyleSolid
See Also
Copyright (c) 1998-2024 Codejock Technologies. All rights reserved.