ChartPieSeriesStyle Object
See Also
Description
2D Pie Chart or 2D Doughnut Chart style.
For a list of all members defined in this module, see ChartPieSeriesStyle Members.
Object Model







Remarks
A pie chart displays a series of data as "slices" of a "pie". The data in the pie chart will be divided into slices; each slice represents a percentage of the pie. The size of each slice is proportional to the data it represents, and all slices combine to represent the whole value.
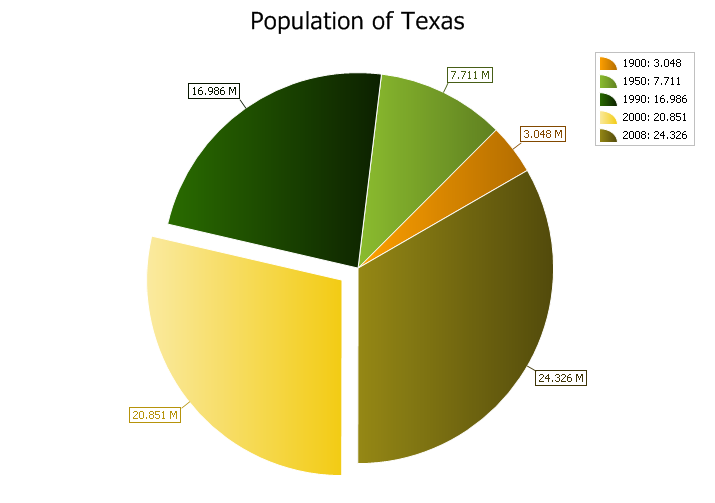
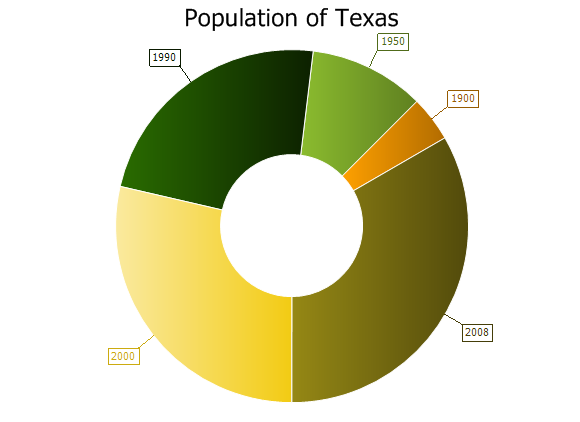
A Doughnut chart functions exactly the same as a pie chart, except there is a blank hole in the middle.
Example
' Pie 2D series sample
ChartControl.Content.Titles.Add "Population of Texas"
ChartControl.Content.Legend.Visible = True

Dim Series As ChartSeries
Set Series = ChartControl.Content.Series.Add("Texas")

CreatePiePoint Series.Points, "1900", "3.048", 3048
CreatePiePoint Series.Points, "1950", "7.711", 7711
CreatePiePoint Series.Points, "1990", "16.986", 16986
CreatePiePoint Series.Points, "2000", "20.851", 20851
CreatePiePoint Series.Points, "2008", "24.326", 24326

Series.Points(3).Special = True

Dim Style As ChartPieSeriesStyle
Set Style = New ChartPieSeriesStyle
Set ChartControl.Content.Series(0).Style = Style
Style.Label.Format = "%.3f M"

'Style.HolePercent = 40
Style.Rotation = 30
Style.Label.Visible = True
'Style.Label.ShowLines = False
'Style.ExplodedDistancePercent = 30

cmbPieLabelPosition.ListIndex = Style.Label.Position
Style.Label.Antialiasing = False

Sub CreatePiePoint(ByVal pPointCollection As ChartSeriesPointCollection, lpszLegendText As String, vArg As Variant, nValue As Integer)
    Dim pPoint As ChartSeriesPoint
    Set pPoint = pPointCollection.Add(vArg, nValue)
    pPoint.LegendText = lpszLegendText
End Sub
See Also
Copyright (c) 1998-2024 Codejock Technologies. All rights reserved.