ChartPalette Object
Description
Represents a palette used to color a series.
For a list of all members defined in this module, see ChartPalette Members.
Remarks
Palettes are used to color the elements of a chart series (points, slices, legend, etc.). Palettes affect the colors of the series and legend, but do not affect the actual chart. This chart comes with many pre-set palettes for the chart series to use.
Current Pre-set Palettes
- Victorian
- Vibrant Pastel
- Vibrant
- Tropical
- Summer
- Spring Time
- Rainbow
- Purple
- Primary Colors
- Postmodern
- Photodesign
- Pastel
- Office
- Orange Green
- Nature
- Natural
- Impressionism
- Illustration
- Harvest
- Green Brown
- Green Blue
- Green
- Gray
- Four Color
- Fire
- Earth Tone
- Danville
- Caribbean
- Cappuccino
- Blue Gray
- Blue
A custom palette can also be created, or colors in an existing palette can be modified and added.
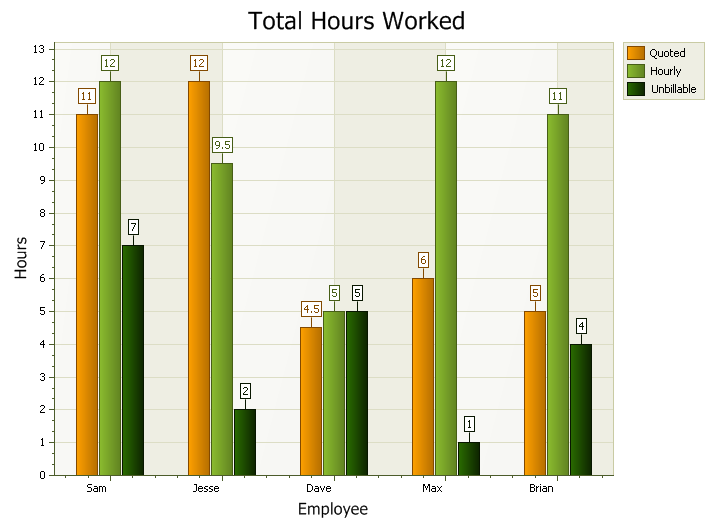
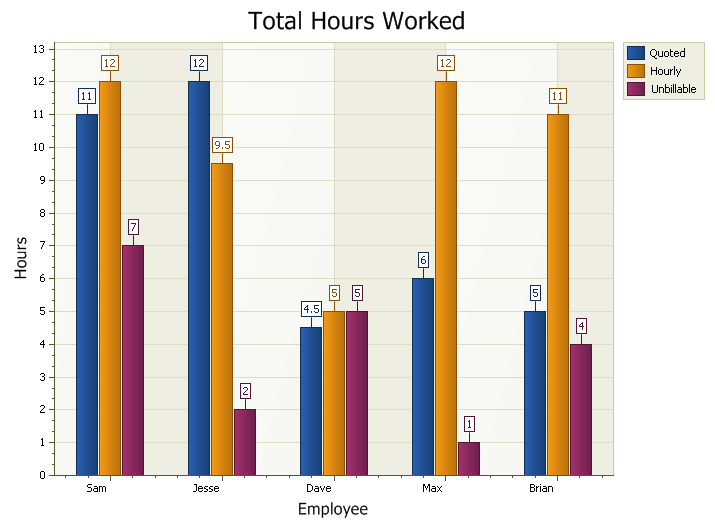
Below is the same diagram using two different palettes ("Postmodern" and "Photodesign"). Notice how only the series and legend are affected:
See Also
Copyright (c) 1998-2024 Codejock Technologies. All rights reserved.