ChartFunnelSeriesStyle Object
Description
Funnel Chart style
For a list of all members defined in this module, see ChartFunnelSeriesStyle Members.
Object Model






Remarks
The Funnel chart displays a series of data in a funnel shape. The top portion of the funnel will typically contain the largest percentage of the data, while the bottom will "funnel" down to the smallest percentage. However, the funnel will allow data to be added in any combination to suit your needs. The size of the funnel sections are all relative to each other, and the order does not matter.
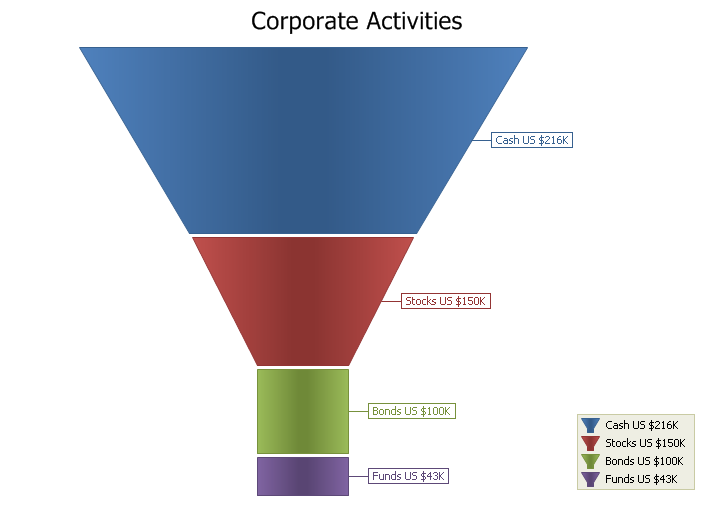
Example
ChartControl.Content.Legend.Visible = True
ChartControl.Content.Legend.HorizontalAlignment = xtpChartLegendFar
ChartControl.Content.Legend.VerticalAlignment = xtpChartLegendFar

If ChartControl.Content.Series.Count > 0 Then
    ChartControl.Content.Series.DeleteAll
End If

ChartControl.Content.Titles.Add "Corporate Activities"

Dim Series As ChartSeries
Set Series = ChartControl.Content.Series.Add("Corporate Activities")

Series.Points.Add "Cash US", 216
Series.Points.Add "Stocks US", 150
Series.Points.Add "Bonds US", 100
Series.Points.Add "Funds US", 43

Series.PointLegendFormat = "{A} ${V}K"

Dim Style As New ChartFunnelSeriesStyle
Set ChartControl.Content.Series(0).Style = Style
Style.Label.Format = "{A} ${V}K"

cmbPointDistance.AddItem "0"
cmbPointDistance.AddItem "1"
cmbPointDistance.AddItem "2"
cmbPointDistance.AddItem "3"
cmbPointDistance.AddItem "4"

cmbHeightToWidth.AddItem "0"
cmbHeightToWidth.AddItem "0.4"
cmbHeightToWidth.AddItem "0.6"
cmbHeightToWidth.AddItem "1"
cmbHeightToWidth.AddItem "1.5"
cmbHeightToWidth.AddItem "2"
See Also
ChartFunnelSeriesStyle Members
Copyright (c) 1998-2024 Codejock Technologies. All rights reserved.