ChartFastLineSeriesStyle Object
Description
Fast Line style (use when plotting thousands of points and drawing speed is important).
For a list of all members defined in this module, see ChartFastLineSeriesStyle Members.
Object Model






Remarks
Fast line is a variation of the normal line style that considerably improves performance by reducing the time it takes to draw the line. The increased speed comes at the cost of not displaying the plot points in the line, and you can't display labels (among other things done behind the scenes).
With fast line, you can also turn off antialiasing. Common uses for a fast line might be a system performance monitor that shows a chart in real time or possibly a chart that displays thousands of data points in a single view (might show a trend over 10,000 years in a single view).
In the diagram below, there are 5 "fast lines" that have 1000 points drawn every 10 milliseconds. You can view the sample in full motion by running the included samples.
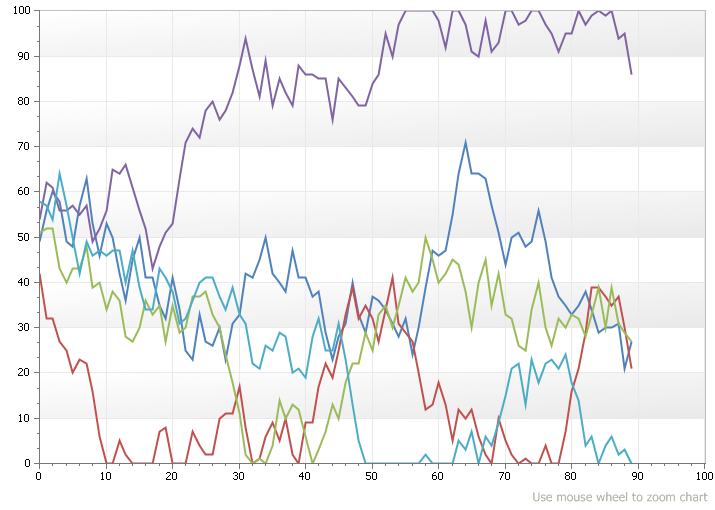
Example
Complete VB6 sample showing the above picture. (The sample is included with the installation as well in the "Chart Browser" sample.)
Private Sub UserControl_Initialize()
    cmblInterval.AddItem "100"
    cmblInterval.AddItem "300"
    cmblInterval.AddItem "500"
    cmblInterval.AddItem "1000"
    cmblInterval.ListIndex = 0

    cmbSeriesCount.AddItem "1"
    cmbSeriesCount.AddItem "2"
    cmbSeriesCount.AddItem "3"
    cmbSeriesCount.AddItem "4"
    cmbSeriesCount.AddItem "5"
    cmbSeriesCount.ListIndex = 0

    ChartControl.Content.Legend.Visible = False

    Dim Title As ChartTitle
    Set Title = ChartControl.Content.Titles.Add("Use mouse wheel to zoom chart")
    Title.Docking = xtpChartDockBottom
    Title.Alignment = xtpChartAlignFar

    Title.Font.StdFont.Size = 9
    Title.TextColor = vbGrayText

    CreateChart
End Sub

Private Sub CreateChart()
    ChartControl.Content.Series.DeleteAll

    Dim Series As ChartSeries
    Dim SeriesCount As Long
    SeriesCount = cmbSeriesCount.List(cmbSeriesCount.ListIndex)

    Dim i As Long
    For i = 1 To SeriesCount
        Set Series = ChartControl.Content.Series.Add("Series")
        Dim Style As New ChartFastLineSeriesStyle
        Set Series.Style = Style
        Series.ArgumentScaleType = xtpChartScaleNumerical
    Next i

    Dim Diagram As ChartDiagram2D
    Set Diagram = ChartControl.Content.Diagrams(0)

    Diagram.AllowZoom = True
    Diagram.AxisY.Range.MaxValue = 100.1
    Diagram.AxisY.Range.AutoRange = False
    Diagram.AxisY.AllowZoom = False

    Diagram.AxisX.Range.MaxValue = 100.1
    Diagram.AxisX.Range.AutoRange = False
    Diagram.AxisX.Range.ZoomLimit = 10

    Diagram.AxisX.Interlaced = False
    Diagram.AxisY.Interlaced = chkInterlaced

    chkAntialiased_Click
End Sub

Private Sub cmdAddPoints_Click()
    Dim i As Long
    For i = 1 To 1000
        AddPoint
    Next i
End Sub

Private Sub cmblInterval_Click()
    Timer.Interval = cmblInterval.List(cmblInterval.ListIndex)
End Sub

Private Sub cmbSeriesCount_Click()
    CreateChart
End Sub

Private Sub chkAntialiased_Click()
    Dim Series As ChartSeries
    For Each Series In ChartControl.Content.Series
        Series.Style.Antialiasing = chkAntialiased
    Next
End Sub

Private Sub chkInterlaced_Click()
    Dim Diagram As ChartDiagram2D
    Set Diagram = ChartControl.Content.Diagrams(0)
    Diagram.AxisY.Interlaced = chkInterlaced
End Sub

Private Sub AddPoint()
    Dim Series As ChartSeries
    Dim Value As Long, Count As Long

    For Each Series In ChartControl.Content.Series
        Value = 50
        Count = Series.Points.Count
        If (Count > 0) Then Value = Series.Points(Count - 1).Value(0)
        Value = Value + (Rnd() * 20) - 10
        If (Value < 0) Then Value = 0
        If (Value > 100) Then Value = 100
        Series.Points.Add Count, Value
    Next

    Dim Diagram As ChartDiagram2D
    Set Diagram = ChartControl.Content.Diagrams(0)

    If (Count > 100) Then
        Dim AutoScroll As Boolean
        AutoScroll = IIf(Diagram.AxisX.Range.ViewMaxValue = Diagram.AxisX.Range.MaxValue, True, False)

        Diagram.AxisX.Range.MaxValue = Count

        If (AutoScroll) Then
            Dim delta As Double
            delta = Diagram.AxisX.Range.ViewMaxValue - Diagram.AxisX.Range.ViewMinValue
            Diagram.AxisX.Range.ViewAutoRange = False
            Diagram.AxisX.Range.ViewMaxValue = Count
            Diagram.AxisX.Range.ViewMinValue = Count - delta
        End If
    End If
End Sub

Private Sub Timer_Timer()
    AddPoint
End Sub

Private Sub UserControl_Resize()
    On Error Resume Next
    lblTitle.Width = ScaleWidth - 2 * gbOptions.Left
    gbOptions.Width = ScaleWidth - 2 * gbOptions.Left
    ChartControl.Move ChartControl.Left, ChartControl.Top, ScaleWidth - 2 * ChartControl.Left, ScaleHeight - ChartControl.Top - 8
End Sub
See Also
ChartFastLineSeriesStyle Members
Copyright (c) 1998-2024 Codejock Technologies. All rights reserved.