ChartCandleStickSeriesStyle Object
Description
Candle Stick/Financial/Stock chart style.
For a list of all members defined in this module, see ChartCandleStickSeriesStyle Members.
Object Model




Remarks
A Candlestick Chart is used to display trends for financial data, generally stock market prices. Candlestick charts are much easier to read than a traditional bar chart for a stock market trader. The candlesticks make it fast and easy to compare the high and low, open and close of data. Each "candlestick" represents the high, low, open, and close of data for a given value. The relationship between these candles is important in determining trends among stock prices.
- The "open" and "close" values are displayed as the "body" of the candle.
- The "high" and "low" are displayed as simple lines above and below the body.
- Buying pressure is indicated with hollow candles, where the close is greater than the previous high.
- Selling pressure is indicated with a filled red candle, where its close value is lower than the previous close value.
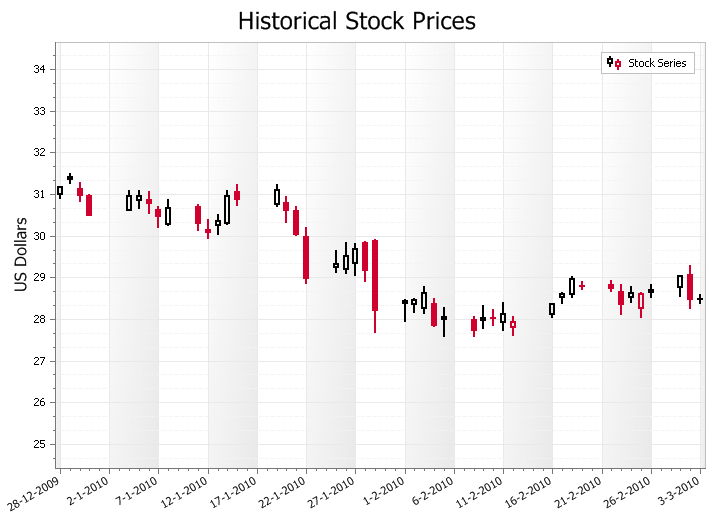
Example
// Candlestick series sample

ChartControl.Content.Titles.DeleteAll
ChartControl.Content.Titles.Add "Historical Stock Prices"

Dim Series As ChartSeries
Set Series = ChartControl.Content.Series.Add("Stock Series")

Series.Points.Add4 "2009-12-28", 30.89, 31.18, 31, 31.17
Series.Points.Add4 "2009-12-29", 31.23, 31.5, 31.35, 31.39
Series.Points.Add4 "2009-12-30", 30.8, 31.29, 31.15, 30.96
Series.Points.Add4 "2009-12-31", 30.48, 30.99, 30.98, 30.48
Series.Points.Add4 "2010-01-04", 30.59, 31.1, 30.62, 30.95
Series.Points.Add4 "2010-01-05", 30.64, 31.1, 30.85, 30.96
Series.Points.Add4 "2010-01-06", 30.52, 31.08, 30.88, 30.77
Series.Points.Add4 "2010-01-07", 30.19, 30.7, 30.63, 30.45
Series.Points.Add4 "2010-01-08", 30.24, 30.88, 30.28, 30.66
Series.Points.Add4 "2010-01-11", 30.12, 30.76, 30.71, 30.27
Series.Points.Add4 "2010-01-12", 29.91, 30.4, 30.15, 30.07
Series.Points.Add4 "2010-01-13", 30.01, 30.52, 30.26, 30.35
Series.Points.Add4 "2010-01-14", 30.26, 31.1, 30.31, 30.96
Series.Points.Add4 "2010-01-15", 30.71, 31.24, 31.08, 30.86
Series.Points.Add4 "2010-01-19", 30.68, 31.24, 30.75, 31.1
Series.Points.Add4 "2010-01-20", 30.31, 30.94, 30.81, 30.59
Series.Points.Add4 "2010-01-21", 30, 30.72, 30.61, 30.01
Series.Points.Add4 "2010-01-22", 28.84, 30.2, 30, 28.96
Series.Points.Add4 "2010-01-25", 29.1, 29.66, 29.24, 29.32
Series.Points.Add4 "2010-01-26", 29.09, 29.85, 29.2, 29.5
Series.Points.Add4 "2010-01-27", 29.02, 29.82, 29.35, 29.67
Series.Points.Add4 "2010-01-28", 28.89, 29.87, 29.84, 29.16
Series.Points.Add4 "2010-01-29", 27.66, 29.92, 29.9, 28.18
Series.Points.Add4 "2010-02-01", 27.92, 28.48, 28.39, 28.41
Series.Points.Add4 "2010-02-02", 28.14, 28.5, 28.37, 28.46
Series.Points.Add4 "2010-02-03", 28.12, 28.79, 28.26, 28.63
Series.Points.Add4 "2010-02-04", 27.81, 28.5, 28.38, 27.84
Series.Points.Add4 "2010-02-05", 27.57, 28.28, 28, 28.02
Series.Points.Add4 "2010-02-08", 27.57, 28.08, 28.01, 27.72
Series.Points.Add4 "2010-02-09", 27.75, 28.34, 27.97, 28.01
Series.Points.Add4 "2010-02-10", 27.84, 28.24, 28.03, 27.99
Series.Points.Add4 "2010-02-11", 27.7, 28.4, 27.93, 28.12
Series.Points.Add4 "2010-02-12", 27.58, 28.06, 27.81, 27.93
Series.Points.Add4 "2010-02-16", 28.02, 28.37, 28.13, 28.35
Series.Points.Add4 "2010-02-17", 28.36, 28.65, 28.53, 28.59
Series.Points.Add4 "2010-02-18", 28.51, 29.03, 28.59, 28.97
Series.Points.Add4 "2010-02-19", 28.69, 28.92, 28.79, 28.77
Series.Points.Add4 "2010-02-22", 28.65, 28.94, 28.84, 28.73
Series.Points.Add4 "2010-02-23", 28.09, 28.83, 28.68, 28.33
Series.Points.Add4 "2010-02-24", 28.38, 28.79, 28.52, 28.63
Series.Points.Add4 "2010-02-25", 28.02, 28.65, 28.27, 28.6
Series.Points.Add4 "2010-02-26", 28.51, 28.85, 28.65, 28.67
Series.Points.Add4 "2010-03-01", 28.53, 29.05, 28.77, 29.02
Series.Points.Add4 "2010-03-02", 28.24, 29.3, 29.08, 28.46
Series.Points.Add4 "2010-03-03", 28.35, 28.61, 28.51, 28.46

Series.ArgumentScaleType = xtpChartScaleDateTime

Dim StyleHL As ChartCandleStickSeriesStyle
Set StyleHL = New ChartCandleStickSeriesStyle
Set ChartControl.Content.Series(0).Style = StyleHL
StyleHL.LineThickness = 2
ChartControl.Content.Series(0).ArgumentScaleType = xtpChartScaleQualitative

Dim Diagram As ChartDiagram2D
Set Diagram = ChartControl.Content.Series(0).Diagram

Diagram.AxisX.Label.Angle = 360 - 30
Diagram.AxisX.Label.Antialiasing = True
Diagram.AxisX.Label.Visible = False

Diagram.AxisY.Title = "US Dollars"
Diagram.AxisY.Title.Visible = True
Diagram.AxisY.Visible = True
Diagram.AxisY.Range.ShowZeroLevel = False
Diagram.AxisY.GridLines.MinorLineStyle.DashStyle = xtpChartDashStyleDashDot
Diagram.AxisY.GridLines.MinorVisible = True
See Also
ChartCandleStickSeriesStyle Members
Copyright (c) 1998-2024 Codejock Technologies. All rights reserved.