ChartBubbleSeriesStyle Object
Description
Bubble chart style.
For a list of all members defined in this module, see ChartBubbleSeriesStyle Members.
Object Model





Remarks
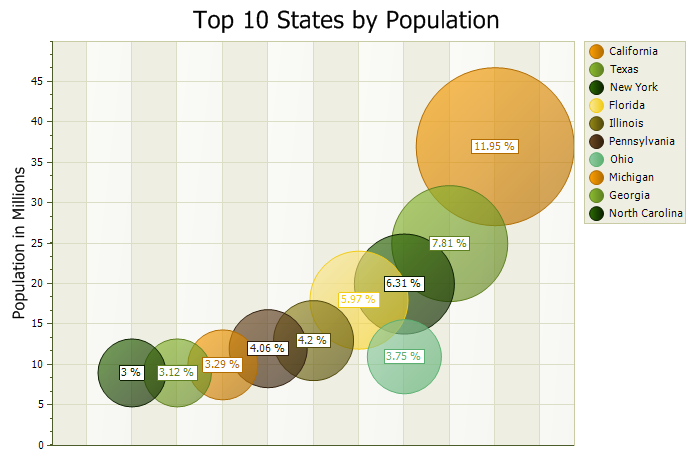
A bubble chart is just a variation of a point chart, only it displays bubbles of the data points. Data is displayed in a grid using Cartesian coordinates. Data is displayed along the x and y axis, where x and y can represent any type of data (as in the chart below, x - decades, y - population).
Example
' Bubble series sample

ChartControl.Content.Titles.Add "Top 10 States by Population"
ChartControl.Content.Legend.Visible = True
ChartControl.Content.Legend.HorizontalAlignment = xtpChartLegendFarOutside

Dim Series As ChartSeries
Set Series = ChartControl.Content.Series.Add("Top 10 States by Population")

CreateBubblePoint Series.Points, "California", 8, 37, 11.95
CreateBubblePoint Series.Points, "Texas", 7, 25, 7.81
CreateBubblePoint Series.Points, "New York", 6, 20, 6.31
CreateBubblePoint Series.Points, "Florida", 5, 18, 5.97
CreateBubblePoint Series.Points, "Illinois", 9, 13, 4.2
CreateBubblePoint Series.Points, "Pennsylvania", 10, 12, 4.06
CreateBubblePoint Series.Points, "Ohio", 4, 11, 3.75
CreateBubblePoint Series.Points, "Michigan", 3, 10, 3.29
CreateBubblePoint Series.Points, "Georgia", 2, 9, 3.12
CreateBubblePoint Series.Points, "North Carolina", 1, 9, 3

Series.ArgumentScaleType = xtpChartScaleQualitative

Dim BubbleSeriesStyle As New ChartBubbleSeriesStyle
BubbleSeriesStyle.MinSize = 1.5
BubbleSeriesStyle.MaxSize = 3.5

Set ChartControl.Content.Series(0).Style = BubbleSeriesStyle
' BubbleSeriesStyle.Label.Format = "%g$"
BubbleSeriesStyle.Label.Format = "%g %%"

Dim Diagram As ChartDiagram2D
Set Diagram = ChartControl.Content.Series(0).Diagram
Diagram.AxisY.Title.Text = "Population in Millions"
Diagram.AxisY.Title.Visible = True
Diagram.AxisY.Range.AutoRange = False
Diagram.AxisY.Range.MaxValue = 50
Diagram.AxisY.Range.MinValue = 0
Diagram.AxisX.Title.Visible = False
Diagram.AxisX.Visible = True
Diagram.AxisX.Reversed = True
Diagram.AxisX.TickMarks.Visible = False
Diagram.AxisX.Label.Visible = False
' Diagram.AxisY.Range.ShowZeroLevel = False

txtMinBubbleSize.Text = BubbleSeriesStyle.MinSize
txtMaxBubbleSize.Text = BubbleSeriesStyle.MaxSize

Sub CreateBubblePoint(ByVal pPointCollection As ChartSeriesPointCollection, lpszLegendText As String, nYear As Integer, nValue As Integer, dWidth As Double)
    Dim pPoint As ChartSeriesPoint
    Set pPoint = pPointCollection.Add2(nYear, nValue, dWidth)
    pPoint.LegendText = lpszLegendText
End Sub
See Also
ChartBubbleSeriesStyle Members
Copyright (c) 1998-2024 Codejock Technologies. All rights reserved.