Logarithmic Property
Description
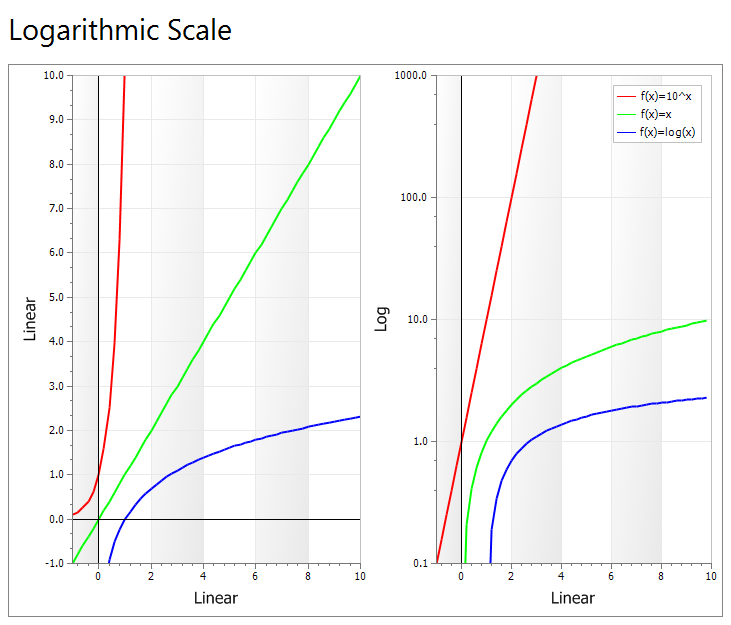
Specifies whether to use a logarithmic scale for this axis with the base specified by LogarithmicBase.
Property type
Read-write property
Syntax (Visual Basic)
Public Property Logarithmic() As Boolean
Return type
Boolean — True if this axis uses a logarithmic base; False if it uses a linear base.
Remarks
A logarithmic scale allows data across a very large range to be displayed in an easy-to-read chart. The base of the scale is specified by LogarithmicBase, with a default of base 10.
Example
' Logarithmic scale sample
Private Sub Form_Load()

    ChartControl.Content.Legend.Visible = True
    ChartControl.Content.Legend.HorizontalAlignment = xtpChartLegendFar

    Dim Diagram As ChartDiagram2D
    Set Diagram = New ChartDiagram2D
    ChartControl.Content.Diagrams.Add Diagram

    Diagram.AxisY.Title = "Linear"
    Diagram.AxisX.Title = "Linear"
    Diagram.AxisX.Title.Visible = True

    Diagram.AxisY.Title.Visible = True
    Diagram.AxisY.Label.Format.Category = xtpChartNumber
    Diagram.AxisY.Label.Format.DecimalPlaces = 1
    Diagram.AxisY.Label.Format.UseThousandSeparator = False

    Diagram.AxisY.Range.AutoRange = False
    Diagram.AxisY.Range.MinValue = -1
    Diagram.AxisY.Range.MaxValue = 10

    Diagram.AxisX.Range.AutoRange = False
    Diagram.AxisX.Range.MinValue = -1
    Diagram.AxisX.Range.MaxValue = 10

    Dim Line As ChartAxisConstantLine

    If (Diagram.AxisX.ConstantLines.Count = 0) Then
        Set Line = Diagram.AxisX.ConstantLines.Add("")
        Line.AxisValue = 0
        Line.LegendVisible = False
    End If

    If (Diagram.AxisY.ConstantLines.Count = 0) Then
        Set Line = Diagram.AxisY.ConstantLines.Add("")
        Line.AxisValue = 0
        Line.LegendVisible = False
    End If

    AddSeriesCombination Diagram, False

    Set Diagram = New ChartDiagram2D
    ChartControl.Content.Diagrams.Add Diagram

    Diagram.AxisY.Title = "Log"
    Diagram.AxisX.Title = "Linear"
    Diagram.AxisX.Title.Visible = True

    Diagram.AxisY.Logarithmic = True
    Diagram.AxisY.LogarithmicBase = 10
    Diagram.AxisY.Title.Visible = True
    Diagram.AxisY.Label.Format.Category = xtpChartNumber
    Diagram.AxisY.Label.Format.DecimalPlaces = 1
    Diagram.AxisY.Label.Format.UseThousandSeparator = False

    Diagram.AxisY.Range.AutoRange = False
    Diagram.AxisY.Range.MinValue = 0.1
    Diagram.AxisY.Range.MaxValue = 1000

    Diagram.AxisX.Range.AutoRange = False
    Diagram.AxisX.Range.MinValue = -1
    Diagram.AxisX.Range.MaxValue = 10

    If (Diagram.AxisX.ConstantLines.Count = 0) Then
        Set Line = Diagram.AxisX.ConstantLines.Add("")
        Line.AxisValue = 0
        Line.LegendVisible = False
    End If

    AddSeriesCombination Diagram, True

End Sub

Sub AddSeriesCombination(Diagram As ChartDiagram, LogY As Boolean)

    Dim Series As ChartSeries

    Set Series = ChartControl.Content.Series.Add("f(x)=10^x")
    Series.ArgumentScaleType = xtpChartScaleNumerical
    Set Series.Style = CreateSeriesStyle
    Set Series.Diagram = Diagram
    Series.Style.Color = vbRed
    If (Not Diagram Is ChartControl.Content.Diagrams(0)) Then Series.LegendVisible = False

    Dim x As Single, xStart As Single

    For x = -2 To 10 Step 0.2
        Series.Points.Add x, 10 ^ x
    Next x

    Set Series = ChartControl.Content.Series.Add("f(x)=x")
    Series.ArgumentScaleType = xtpChartScaleNumerical
    Set Series.Style = CreateSeriesStyle
    Set Series.Diagram = Diagram
    Series.Style.Color = vbGreen
    If (Not Diagram Is ChartControl.Content.Diagrams(0)) Then Series.LegendVisible = False

    xStart = IIf(LogY, 0.01, -1)

    For x = xStart To 10 Step 0.2
        Series.Points.Add x, x
    Next x

    Set Series = ChartControl.Content.Series.Add("f(x)=log(x)")
    Series.ArgumentScaleType = xtpChartScaleNumerical
    Set Series.Style = CreateSeriesStyle
    Set Series.Diagram = Diagram
    Series.Style.Color = vbBlue
    If (Not Diagram Is ChartControl.Content.Diagrams(0)) Then Series.LegendVisible = False

    xStart = IIf(LogY, 1.01, 0.2)

    For x = xStart To 10 Step 0.2
        Debug.Print "log " & x & " - " & Math.log(x)
        Series.Points.Add x, Math.log(x)
    Next x

End Sub
See Also
Copyright (c) 1998-2024 Codejock Technologies. All rights reserved.