ViewAutoRange Property
Description
Use this in combination with AutoRange to create a scrollable chart. This specifies whether to manually set the minimum and maximum value range for the "view," which is the portion of the axis that is visible.
Property Type
Read-write property
Syntax (Visual Basic)
Public Property ViewAutoRange() As Boolean
Remarks
The "view" portion of an axis range is the values of the axis that are currently in view when the axis is scrollable. To make a chart axis scrollable, you must set both ViewAutoRange and AutoRange to False. Then you set the axis's MaxValue and MinValue to the maximum and minimum values that the axis will contain (maximum values the axis can scroll to).
Finally, you set the "view" of the axis, which can be thought of as a subset of the range that was set with MaxValue and MinValue. To do this, you set the ViewMaxValue and ViewMinValue values to a subset of values in the axis. This will create a scrollable axis between MaxValue and MinValue where the portion of the axis in view is between ViewMaxValue and ViewMinValue.
If you use the secondary axis, you will need to do these steps for both axes. Then you can independently scroll the axes.
If you don't intend to have a scrollable axis, then you do not need to set any of the "view" values; they will be automatically calculated by the axis.
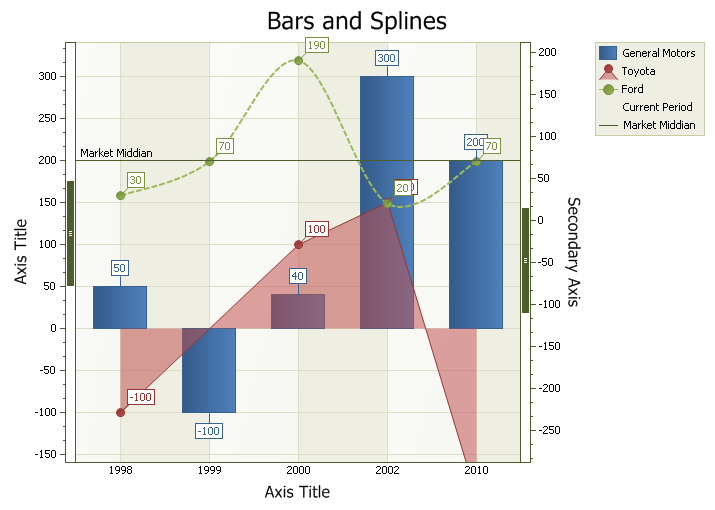
The diagram below shows a scrollable chart using the code below.
Example
This code will create a scrollable axis along the Y axis where the total length of the axis is between 1000 and -1000 and at any given time the maximum amount of the axis visible is 500, initially set to the values of 250 and -250.
Diagram.AxisY.Range.ViewAutoRange = False
Diagram.AxisY.Range.AutoRange = False

Diagram.AxisY.Range.MaxValue = 1000
Diagram.AxisY.Range.MinValue = -1000
Diagram.AxisY.Range.ViewMaxValue = 250
Diagram.AxisY.Range.ViewMinValue = -250
If you have a secondary axis, you can independently set its view as well.
Diagram.SecondaryAxisY.Range.ViewAutoRange = False
Diagram.SecondaryAxisY.Range.AutoRange = False
Diagram.SecondaryAxisY.Range.MaxValue = 1000
Diagram.SecondaryAxisY.Range.MinValue = -1000
Diagram.SecondaryAxisY.Range.ViewMaxValue = 250
Diagram.SecondaryAxisY.Range.ViewMinValue = -250
See Also
- ChartAxisRange Object
- MaxValue Property
- MinValue Property
- ViewMaxValue Property
- ViewMinValue Property
- AutoRange Property
Copyright (c) 1998-2024 Codejock Technologies. All rights reserved.