ChartAxisConstantLine Object
Description
Represents a constant line parallel to an axis.
For a list of all members defined in this module, see ChartAxisConstantLine Members.
Object Model





Remarks
Constant lines are just that, a constant line drawn in the chart at a specific value along the X or Y axis. You can have as many constant lines as you need.
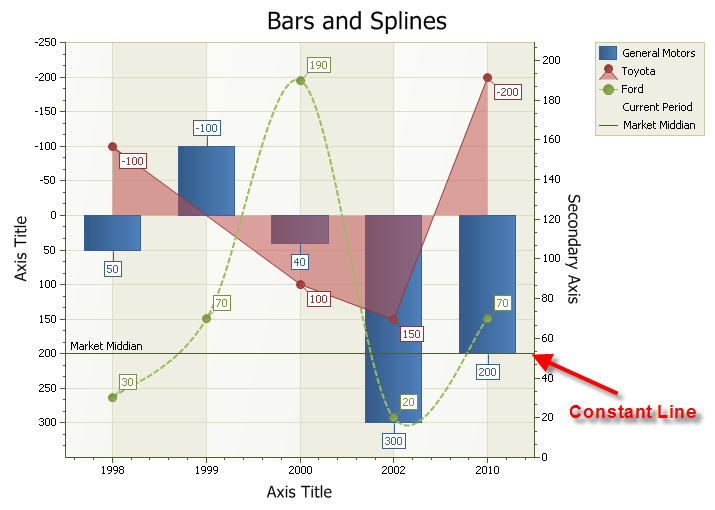
Example
Dim Line As ChartAxisConstantLine
Set Line = Diagram.AxisY.ConstantLines.Add("Market Median")
Line.AxisValue = 200
See Also
Copyright (c) 1998-2024 Codejock Technologies. All rights reserved.